Seaborn Introduction
Seaborn, a Python data visualization library built on Matplotlib, offers an elegant and efficient solution for creating compelling statistical graphics. Its concise syntax, built-in themes, and color palettes simplify the plot generation process, making it a top choice for data scientists. Integrated with Pandas DataFrames and seamlessly combined with Matplotlib, Seaborn provides a powerful toolkit for creating informative and visually pleasing visualizations, making it invaluable for Python data visualization.
Line Plots
To draw a line plot with hues, error bars, and color palettes, utilize Pandas.DataFrame.
data_grp = [
    data('./1201/120101.txt', '1201', 0.1045, 4, backgrnd_list1),
    data('./1201/120102.txt', '1201', 0.1275, 4, backgrnd_list1),
    data('./1201/120103.txt', '1201', 0.108, 4, backgrnd_list1),
]

# Define a function to convert data objects to a dictionary
data_to_dict = lambda data_obj: {'filename': data_obj.filename, 'date': data_obj.date, 'dist': data_obj.dist, 'time': data_obj.time, 'backgrnd_list': data_obj.backgrnd_list, 'integral': data_obj.integral}

# Convert data objects to dictionaries and then to a Pandas DataFrame
df = pd.DataFrame(list(map(data_to_dict, data_grp)))

# Filter categories with 'date' equal to '1201'
df0 = pd.concat([df[df['date']=='1201'], df[df['date']=='1209']], axis=0)
df1 = df[df['date']=='1208']
df1.loc[:,'integral'] += 70  # For date '1208', add 70 to 'integral'

import seaborn as sns
sns.set_theme(style="darkgrid")
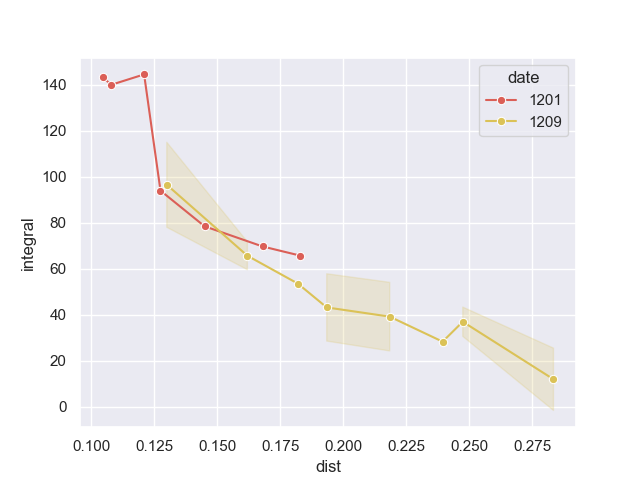
ax = sns.lineplot(data=df0, x='dist', y='integral', hue='date', marker='o', err_style='band', ci=0.8, palette=sns.color_palette("hls", 8))

# Save the plot
fig = ax.get_figure()
fig.savefig('integral.png')
To draw an error band, ensure data has the same X values, e.g., (1, 0.9) and (1, 1.1), as multiple measurements of Y under the same X circumstance.
Resulting plot:
